Tourism and Migration Statistics is a monthly publication of the number of travelers crossing our border, both visitors and residents.
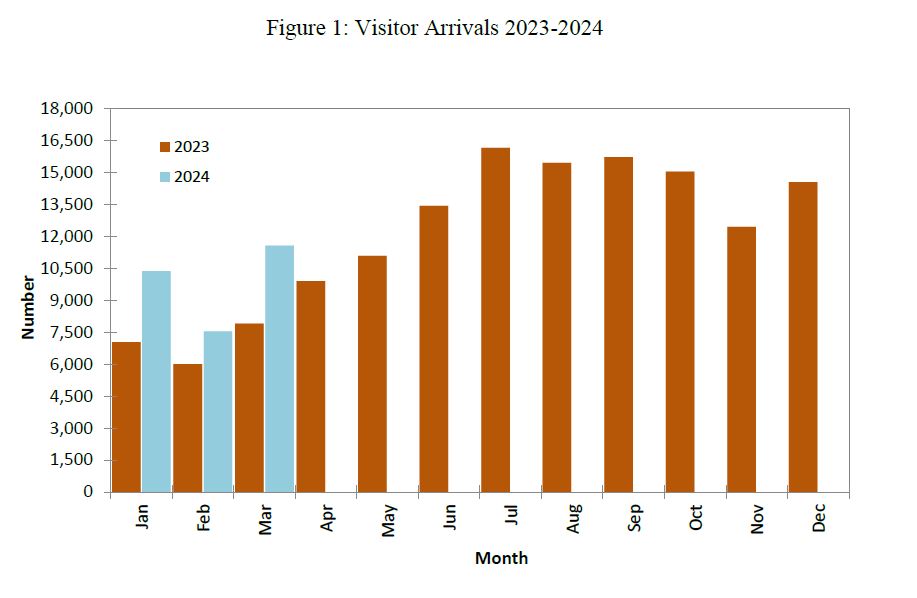
Tourism and Migration Statistics March 2024
Key Facts
In March 2024 compared with March 2023:
Visitor arrivals (11,579). The biggest changes were in arrivals from:
- Australia (up 1,761)
- USA (up 525)
- Europe (up 194).
Overseas trips by Cook Islands residents (1,528)
More information on Tourism and Migration Statistics
Explanatory Notes
1. Source
All data in this release is based on immigration arrival and departure cards as collected by Immigration Officers at the border. These cards are completed on arrival and departure by every individual.
2. Concepts and Definition
A “visitor” refers to any person who travels outside his/her own country of usual residence (irrespective of the purpose of visit). Cook Islanders who normally reside overseas and are visiting the Cook Islands, are classed as visitors. This follows the concept of the usual place of residence.
The “usual place of residence” is the place where the person has resided for most of the last 12 months and will return and reside there.
The “purpose of visit” refers to a motivation of the trip, the reason in which the trip have taken place.
Excess outward and inward migration is calculated by deducting the number of departures from the number arrivals which, when a negative becomes a net outward migration and when positive is net inward migration.