KEY FACTS
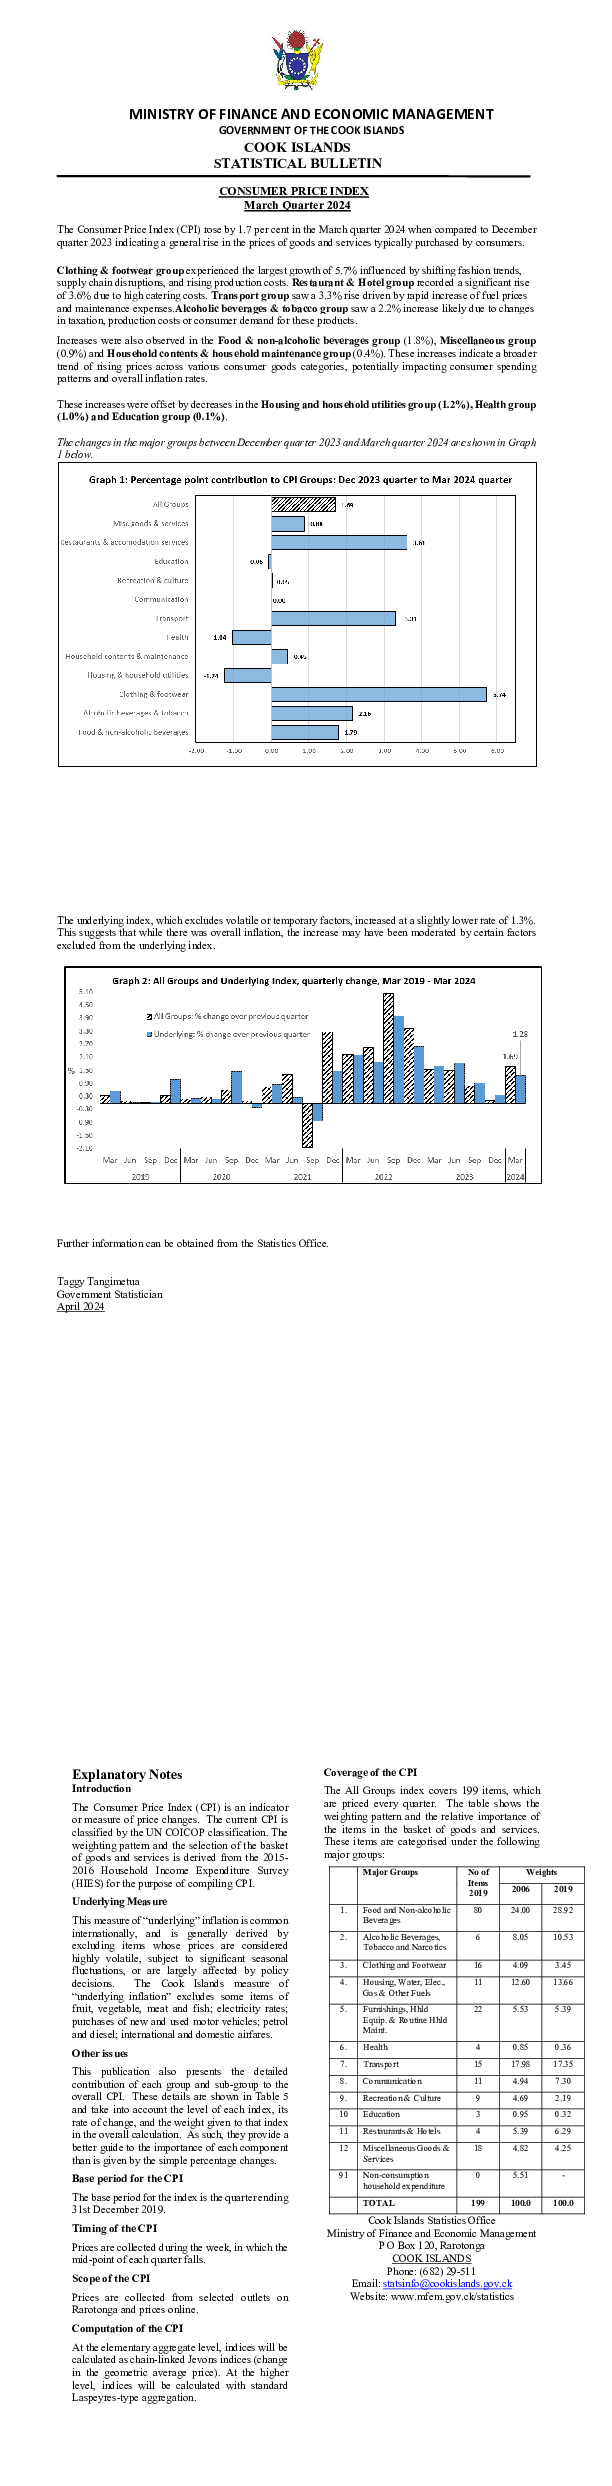
In the March 2024 quarter, the consumer price index (CPI) rose by 1.7 percent compared to the December 2023 quarter, while the Underlying CPI increased by 1.3 percent.
- Clothing and Footwear group experienced a significant 5.7 percent increase, influenced by:
- Clothing up by 7.4%
- Restaurants & Hotelsgroup experienced a significant 3.6% increase, influenced by:
- Catering services up by 3.8%
- Transport experienced a 3.3 percent increase, influenced by
- Operation of personal transport equipment up by 7.5%
- Alcoholic Beverages and Tobacco saw a 2.2 percent increase, influenced by:
- Alcohol up by 3.9%
- Food and Non-Alcoholic Beverages rose by 1.8 percent,
- Miscellaneous Goods & Services increased by 0.9 percent,
- Furnishing, Household Equipment, and Routine Group saw a slight increase of 0.4 percent.
- All these increases were counterbalanced by decreases in Housing and household utilities group by 1.2 percent, Health group by 1.0 percent, and Education group by 0.1 percent.
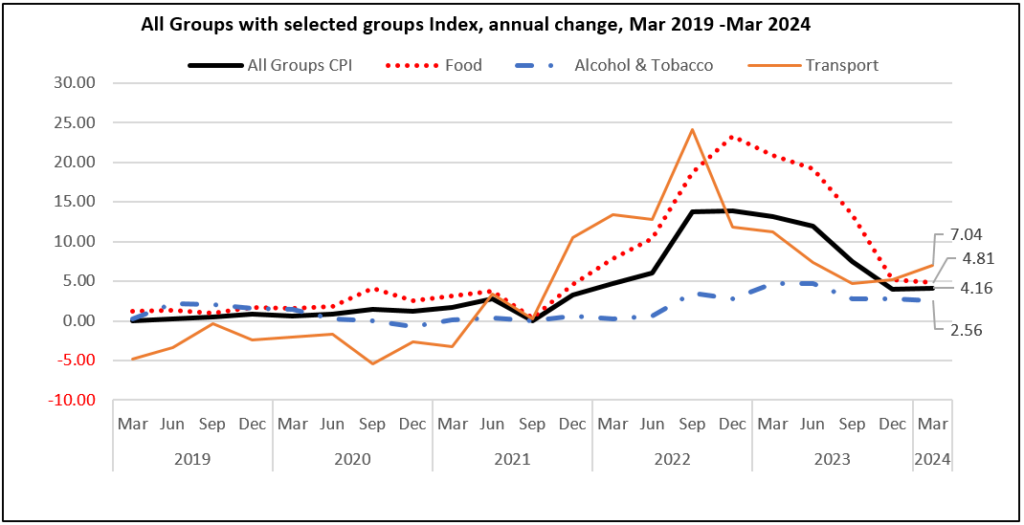
Annual change
From the March 2023 quarter to the March 2024 quarter, the CPI inflation rate was 4.2 percent with the Underlying CPI of 4.5 percent.
- Transport group increased by 7.0%, driven by factors like escalating overseas airfare costs, maintenance and motor vehicle expenses, fuel prices and purchasing vehicles costs
- Air fares increased by 22.3%,
- Maintenance and repair of personal transport equipment up by 4.9%
- Spare parts and accessories for personal transport equipment up by 4.8%
- Fuels up by 4.0%,
- Price of Motor vehicles up by 3.1%
- Food and non-alcoholic beverages group rose by 4.8%, influenced by changes in supply chain dynamics, weather conditions affecting crop yields, or shifts in consumer preferences.
- Sugar, jam, honey, chocolate and confectionery up by 16.3%,
- Mineral water, soft drinks, fruit and vegetable juices up by 14.7%,
- Vegetables by 13.9%,
- Coffee, Tea and cocoa by 10.6%,
- Oils and fats by 10.1%,
- Fruits by 8.9%,
- Milk, cheese and eggs by 6.1%,
- Food products n.e.c. by 5.4%,
- Fish and sea food by 0.7%,
- Bread and cereals by 0.1%
- Alcohol beverages and tobacco group increased by 2.6 per cent, influenced by changes in taxation, production costs, or consumer demand for these products.
- Spirits up by 5.6%
- Tobacco up by 2.4%
- Wine up by 1.6%
- Beer up by 1.6%
More on Consumers Price Index…
Information about CPI
The Consumer Price Index covers price changes of the basket of goods and services consumed by all households on Rarotonga (the main island).
The base year is 2019. Prices are collected for 199 items and from selected outlets around Rarotonga. Individual prices are combined using weights from the Household Income and Expenditure Survey (HIES) conducted in 2015/2016. The HIES information was used to select the basket of goods and services.
The inclusion of an underlying measure is a recent improvement and it is published at the same time as the CPI. The underlying measure excludes items of a highly volatile nature, items that are subject to policy changes.
It excludes some items fruits, vegetables, meat and fish, electricity rates, purchases of new and used motor vehicles, petrol and diesel, international airfares and domestic airfares.
The CPI is calculated as chain-linked Jevons indices (change in the geometric average price). At the higher level, indices will be calculated with standard Laspeyres-type aggregation.